Outside the backdoor of the warehouse at Medtronic Xomed’s Jacksonville, FL, facility there’s a sure sign the lean transformation has spread beyond manufacturing — a large, flat meadow.
The meadow was graded level for the foundation of a planned warehouse addition, a project that ultimately was shelved after a lean transformation of the domestic shipping department freed up thousands of square feet in the warehouse.
“We were going to add 50,000 square feet to this building,” recalled David Duncan, director of logistics, standing on the mezzanine level of the existing 30,000-square-foot warehouse. Steel ceiling rafters are festooned with flags from the 100-plus countries where Xomed sells its microsurgical products to ear, nose, and throat (ENT) specialists. On the warehouse floor, in an area once crammed with conveyors and storage racks, operators in a production cell turn out products to meet burgeoning sales. The cell used to be located in Xomed’s assembly plant next door. Raw materials were delivered to the warehouse then moved to the cell. Finished products were transported back to the warehouse for shipping. Lean improvements freed so much floor space in the warehouse that the assembly cell was moved there from the factory. Now, raw materials come right into the cell, saving time and all the back-and-forth movements.
Such improvements are an illustration of how Xomed is expanding lean beyond the shop floor. What follows is an examination of the lean effort in some of these areas: international distribution, product development, and domestic shipping. We’ll also look at how Xomed leadership is dealing with a struggle point often encountered during a lean transformation — how to reorganize the operational structure along value-streams.
Background
Xomed began the transformation of its 150,000-square-foot plant in late 1999 as a way to keep pace with rapid sales growth while improving profitability and customer service. “We were already a successful, profitable company,” said Jerry Bussell, vice president of global operations. The then-chairman of the publicly held company challenged operations executives to reduce costs and improve value. After months of attending conferences and reading management books, the executives “stumbled” upon lean at a Shingo Prize conference, Bussell recalled.
“We just got blown away” by the success of the Shingo Prize winners, he said. “We saw companies getting results from lean in one year that we didn’t think we could get in 10 years. And they’re telling us we could get the same results.”
The executives “bought every book we could find” at the conference bookstore to educate themselves about lean, said Bussell. They explained the lean strategy to Xomed’s chairman and officers, got their support, and began spreading the lean thinking philosophy by distributing books to key managers.
While absorbing an acquisition, Xomed itself was acquired by Minneapolis-based Medtronic, a medical technology company with nearly $8 billion in sales. The new owners agreed to give the lean effort time to prove itself financially and in early 2000, shop-floor improvements began when outside trainers taught value-stream mapping to 22 managers.
Using the mapping process, Xomed managers identified 40-plus product-family value streams and pinpointed key areas of the value streams where kaizen events would deliver the greatest overall improvement, rather than isolated benefits. Some of the key manufacturing results included:
Box Score of Results from Xomed’s Lean Implementation, 2000 to 2003
| Total production lead time (includes lead time from suppliers) | Cut from 253 days to 129 days |
| Standard order-to-shipment lead time | Reduced 54% |
| Cost of a shipped product | Reduced 38% |
| Labor cost per unit | Reduced 47% |
| Overall distribution costs | Reduced 42% |
| Productivity (annual sales per employee) | Improved 40% |
| On-time delivery (measured as orders shipped within 24 hours of receiving) | Improved from mid 80% to consistently high 90% |
| Manufacturing cycle time | Reduced 97% |
| Scrap | Reduced 85% |
| Rework | Reduced 57% |
| Defective parts per million (PPM) received by customers | Reduced 40% |
| Inventory net turns | Doubled |
| Work in process (WIP) | Improved by more than 20 turns |
| Plant floor space used | Reduced by 50% |
Reorganizing by Value Stream
Leading the effort to continuously improve results is the job of five full-time value-stream managers who are responsible for their products from raw materials to shipping. They guide the improvement process in their respective value streams by drawing current-state value-stream maps to identify waste. Then they plan the elimination of the waste in future-state maps. After the improvements are implemented, the cycle begins again with the future-state map becoming the new current-state map.
Each manager has P&L responsibility for several value streams and reports to Scott Winslow, director of manufacturing. Winslow works closely with Barney Carter, the director of technical services, to make sure that each value stream gets the technical support it needs from engineering, maintenance, tooling, and other support functions.
“We are very much a high-mix, low-volume medical device manufacturer,” explained Carter. The plant’s 392 people make about 6,000 end items, including circuit boards for nerve monitoring equipment, middle ear ventilation tubes, devices for LASIK eye surgery, surgical sponges, and power equipment for sinus surgery. The variety of processes requires a variety of technical skills. Technical staff members, who must support multiple value streams, are assigned to streams based on their expertise. Thus, two value streams might share an electrical engineer. The arrangement is flexible so technical support teams can be formed to work on projects and kaizen events. People in the technical functions report to their departmental managers, but understand that the value-stream managers are their customers.
Every day at 4 p.m., Winslow, Carter, the value-stream managers, and the functional support technicians meet for about 20 minutes in the back of the cafeteria. They quickly review performance problems for the last 24 hours to determine what value streams need more resources.
Once a month the value-stream managers spend an entire day reporting to senior managers on operational and financial performance measures, technical issues, and improvement projects. “Everybody has to be there,” said Bussell, including the buyers, maintenance technicians, engineers, information technology technicians, and other people who support value streams.
Before there were value-stream managers, the plant was organized under business team leaders aligned by major markets. This created one point of contact for a market, but muddled operational responsibility because some production lines made products for more than one market. Management decided to reorganize the plant by value stream, even though “we didn’t know how it was going to work exactly,” recalled Bussell. After four months of identifying product-families, mapping value streams, and creating improvement plans, the business team leaders moved to different roles in the organization and manufacturing managers were “anointed” value-stream managers. Some of the initial managers weren’t comfortable in their new roles and moved to other responsibilities or left. Xomed managers described organizing by value-streams as a continuing “evolution.”
International Distribution
As the lean transformation began to create an efficient, smooth flow of products through the plant, international distribution put the bumps right back into the production schedule. “As we got flow internally, distribution killed us,” said Paul Damian, director of supply chain management.
Large orders arrived sporadically from Xomed’s overseas distribution centers, which served a network of 130 independent distributors. These orders created spikes in demand that disrupted manufacturing schedules, caused overtime, decimated raw material supplies, and wiped out finished goods buffers. They also created service problems for U.S. customers who couldn’t get the products they wanted because a spike in demand from overseas had consumed finished goods stocks. The challenge was to extend the smooth flow of materials and information upstream, beyond the Jacksonville plant to the distribution centers overseas. The solution was to smooth out the peaks and valleys in the demand coming from the distribution centers by leveling the type and quantity of production and filling orders from carefully controlled finished goods markets.
Xomed leveled demand through an electronic pull system. To create the system, Damian and the value-stream managers first analyzed overseas demand product-by-product for a 12 to 18-month period, depending on the product. Then they established target finished goods inventories in Jacksonville and at overseas distributors, based on past demand patterns and shipping lead time. “The whole key to this was getting the target inventory levels right,” said Damian. “We started off high and continuously brought the target levels down.” Target levels are reviewed quarterly.
Demand from overseas distributors and domestic customers was aggregated into a data warehouse that generated a spreadsheet report showing actual inventory levels, target inventory levels, and sales data. The software automatically calculated what had to be shipped to maintain target inventories and instantly converted the information into purchase orders at the distributors overseas. “It eliminated the PO entry, and the inventory planning function on their end,” Damian said. In Jacksonville, production was scheduled to replenish what was shipped from target inventories. The result was a smooth or level production schedule for the plant.
Jacksonville switched from shipping product overseas every two weeks to weekly shipments and encouraged distributors to place orders frequently to avoid spikes in demand. “The more frequently they order, the better,” said Damian.
Sometimes, large orders still arrive from international distributors, but Jacksonville has a process in place to handle them. It will ship up to one third of its target inventory immediately and the rest in two weeks. For example, if the target inventory is 300 boxes and a distributor orders 150, Jacksonville will ask if it can ship 100 boxes now and 50 in two weeks. Jacksonville managers found that these large orders typically represented “stocking orders” from distributors filling shelves, not end-user back orders. “The systems we set in place in manufacturing to keep inventories at target levels can sustain that amount of inventory going out at one time,” Damian explained. “We meet with the value-stream manager to plan production and delivery of the rest of the order. We’ve gotten very little pushback from the distributors with this approach.”
Xomed also worked with selected suppliers. Minimum and maximum levels of raw materials were calculated based on average consumption over a period and the supplier’s capabilities. A buffer was factored in to cover spikes in demand, based on past experience. Suppliers were asked to maintain a minimum level of goods on the shelf at Xomed and no more than the maximum amounts at their facilities. Using an electronic spreadsheet, Xomed gave suppliers weekly updates on consumption and inventory levels so they could maintain parts supplies between the “min and max” levels, explained Damian.
“A supplier’s objective is to ship us every week what we’ve consumed,” he said. “If they ship material ahead of time, they get dinged on delivery performance, and we may return the product to them, depending on how much over the max they shipped.” To help suppliers produce in smaller batches, — paving the way for shorter lead times and lower target inventory levels —Xomed foresees working even closer with suppliers sharing its lean vision.
The lean vision contrasts sharply to the picture Damian found when he came on board in 1993 as a production planner steeped in using material requirements planning (MRP) systems for production scheduling. The plant “was a very typical MRP environment,” he recalled. “An out-of-control MRP environment, but very typical.”
In late 1998, he was sent to France to apply his MRP implementation skills to boost output at a company Xomed had acquired. But by the spring, Xomed managers in Jacksonville were poring over books about lean. “Jerry sent me Lean Thinking,” Damian said. “I read it on a Saturday sitting in a park on a beautiful spring day, and the light bulb went on. I didn’t spend another minute on MRP but immediately started figuring out how to create flow in that plant.” Within a year, productivity was up by 50 percent with no MRP system.
The Accounting Challenge
Despite the shop-floor successes, the lean transformation was setting off alarms in finance. Senior financial managers at Medtronics wanted Xomed to verify the claims that lean was saving money since the benefits weren’t appearing in standard cost accounting reports. The reports generated negative variances because as the lean improvements lowered inventory there were fewer goods to absorb fixed costs, such as overhead allocations.
Using the value-stream maps created to implement the improvements, Accounting Manager Deborah Hamlin set out to verify the financial benefits. “Intuitively, I knew we had saved a lot of money,” she said. “For example, we had a huge acquisition in 1999, and we were able to absorb it without adding direct labor, which continued to drop.”
Using 1998 as a base year, Hamlin restated the finances for every succeeding year to highlight how much cash was actually being spent to make a product. The analysis documented millions of dollars in savings. “There were no soft savings; these were real savings,” said Hamlin, who moved her office from upstairs to the first-floor area occupied by manufacturing, engineering, purchasing, and supply-chain managers so accounting could better support the lean transformation. The accounting analysis showed management at headquarters how the transformation fit with business objectives. Since then, Medtronic has made lean a key strategic initiative and awarded Xomed the company’s highest honor, the Star of Excellence Award. Xomed is helping introduce lean thinking to other Medtronic units by hosting lean symposiums for company executives.
R & D
To get products to market faster, Xomed began mapping the product development process of two major product groups, instruments and capital goods. An instrument could be a simple vent tube of machined plastic. A piece of capital equipment could be a facial nerve monitor with 10 circuit boards, a display screen, and a disk drive. Many of the products in both these families are custom designs.
“We do so many different products that each development is unique,” explained Craig Drager, vice president of research and development. “But there are subprocesses that you go through every time, so those are what we focused on.” He described the approach as analyzing the “building blocks” of the development process.
For example, subprocesses for developing circuit boards included design, layout, and fabrication. “Whether I’m designing a circuit board for equipment A or for equipment B, the process that I go through is the same,” said Drager. “They are building blocks that you will repeat on every piece of electronic capital goods. Let’s take those building blocks and lean them out.” Mapping a subprocess in instrument development identified roughly 50 hours of actual work within a process spanning 140 days internally and at external suppliers, said Drager.
From the maps, process flow spreadsheets were created for the subprocesses so development teams could better estimate delivery dates for customers and track progress. A spreadsheet names each task in the subprocess, identifies who is responsible for each task, and states how much time the task usually takes. Task time is adjusted if the instrument being designed is more or less complicated than the average. For example, if a task is listed as usually taking seven days, but the team estimates that a less complex design will require only four days, “you plug in a minus 4,” said Drager. “If a task is always taking longer, a team can assume that it will take longer when it estimates a project or it can try to understand why that is so and try to improve it.”
The initial effort helped improve the on-time delivery rate for instruments from an average of 40 percent to 88 percent in a year by identifying steps that were combined or streamlined. Bigger results are anticipated as the effort progresses and process steps are eliminated to rapidly accelerate product development.
Domestic Shipping
As the lean transformation of the plant progressed, Duncan, the logistics director, introduced the techniques in domestic shipping, located in the warehouse next door to the plant. First, he had to overcome some initial skepticism.
“We made lots of changes over the years in the warehouse, and I thought we had come to the point where we had done everything we could do,” he said. “The whole warehouse was full of pallet racking, and I had two trailers for storage in the parking lot. I couldn’t get another box in here.”
Duncan was familiar with lean from the implementation in manufacturing, but wondered “what did lean have to do with distribution?” A visit to a Toyota distribution center and service parts warehouse in Toronto, Canada, answered the question. “The first thing I noticed was they didn’t have any conveyors.” That observation ran counter to the experience of warehouse managers “who are used to optimizing operations with automation,” Duncan said. Typically, warehouse improvements involved sessions with automation consultants who invariable recommended “a faster conveyor, a bigger conveyor, or more conveyors.”
Besides automation, Xomed had tried different techniques in the effort to keep up with growing orders. It tried “wave picking” in which everyone was devoted to picking and piling up the goods in the packing area. Then they switched over and everyone worked on packing. The problem was that such batch processing in logistics had the same serious drawback as batch processing in manufacturing — items sat idle waiting for the next step. “Orders piled up everywhere, got mixed up, and took more time to be processed than they should have,” Duncan recalled.
He said the breakthrough in thinking came “when we realized that we manufactured packages in the warehouse. Then we were able to apply lean principles to distribution.” He noted that manufacturing processes had counterparts in distribution:
| Manufacturing Processes | Distribution Processes | |
| Work orders | = | Sales orders |
| Bill of materials | = | Pick lists |
| Raw materials | = | SKUs |
| Assembly | = | Pick and pack |
Following the lean implementation path used in operations, Duncan and hourly team leaders observed activities on the floor and drew a value-stream map of current conditions in domestic shipping. (Observations were done during the busiest part of the day.) They identified five major operations:
- Download customer orders.
- Pick the items ordered.
- Check the orders for accuracy.
- Pack the orders in boxes.
- Label and seal the boxes for freight shipment.
In the current-state map below, the large squares represent processes. Triangles represent work-in-process. Key information is in the small data boxes. The timeline under the squares and triangles compares total lead time through the process with total processing or value-adding time.
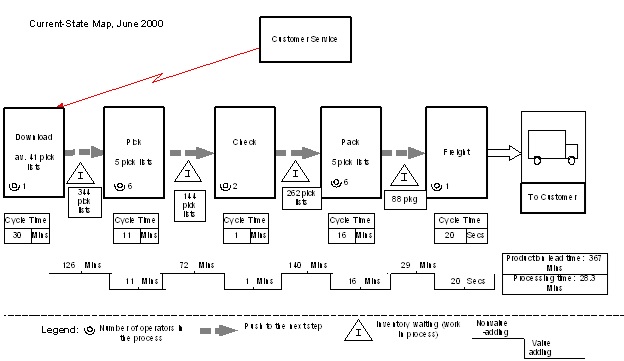
The map showed that an operator at the download station received orders from customer service every 30 minutes. The operator received the orders on a computer terminal and printed them out as lists of products to be “picked” or retrieved from pallets and bins of finished goods inventory in the warehouse. Each of these “pick lists,” as they were called, represented one customer order. Each product the customer wanted appeared on the list as a separate “line item.”
At the pick step, order pickers took five lists (orders) at a time and headed down warehouse aisles to retrieve the needed products (line items). The pickers put the items into totes and rolled them down a straight metal conveyor to the check station. Checkers using scan guns captured lot numbers and verified that each order had the right items in the right quantities. Checkers sent the totes along the conveyor to pack. Packers put the orders into boxes and scanned the items again to verify order accuracy. (Orders often shared totes and could get mixed up while moving along the conveyor between check and pack.) At the next step, freight, an operator accessed customer computer records, generated shipping labels, attached them to cartons, and loaded the cartons onto a truck. At freight, 60-feet of straight conveyor merged into a circular section that held the overflow of packages during busy periods. “We called it a race track because the items just kept going around and around until the freight guy pulled them off,” said Duncan.
Mapping revealed that the daily operation required 16 people and that an order took 367 minutes to progress from initial download to actual shipping. During the 367 minutes of lead time, the order was actually being worked on for just 28.3 minutes. Much of the rest of the time, it was waiting for the next processing step to occur, as represented by the inventory triangles between steps. (Here is how the logistics mapping team calculated the lead time represented by the inventory triangles. We’ll use the triangle between pick and the next step, check. It showed that the logistics team found 144 lists or orders waiting to be checked. In the data box for check, the team recorded its observation that the cycle time for an operator to check an order was one minute. Since there were two people checking orders, it would take them 72 minutes to process the 144 lists or orders in the queue.)
The next action for the logistics team was to map out and implement a leaner future-state by using the information uncovered during the current-state mapping process. For example, scanning at both the check and pack steps was a duplication of work, an obvious waste that the team wanted to eliminate. The problem was how to make sure the orders weren’t mixed up in the totes. Many of Xomed’s products were small and had to be put in totes to prevent them from falling through the conveyor. The team then realized that the conveyor was causing the need for double scanning. If orders were picked, placed on a cart instead of a conveyor, and wheeled to a scanning terminal, then the pick, check, and pack steps could be combined into one “assembly” station. The team made the improvement. The only significant cost was a $3,000 fee to the scanning program vendor for reprogramming.
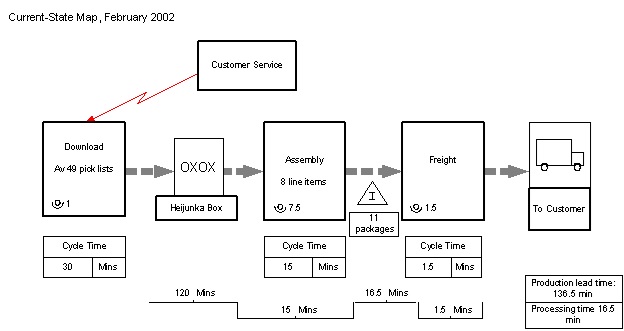
The map above from February 2002 shows this improvement and the introduction of a heijunka box, which “revolutionized the whole process,” according to Duncan.
With rows and columns of narrow slots, the heijunka box looked like an old-fashioned letter sorter. Each picker’s name was put on the Y-axis of the box. Across the X-axis, the box was divided into 15-minute intervals. In the new process, a download operator got orders electronically from customer service every 30 minutes, just as before. Now, instead of printing out each order as a pick list of items to be retrieved, the operator printed out each item ordered on separate slips of paper.
Line items were used instead of pick lists because lists varied in work content. Each list was an order, and some orders were much bigger than others. Line items were a much better standard unit of work. “A line item is a line item,” Duncan explained. “It didn’t matter if a customer ordered one of item A or three of item A, each was a line item. It was really not much more work to pick up one item or three from the same bin.”
The new process called for the download operator to periodically load eight slips of paper (eight line items) into the time slots of the heijunka box. Pickers came to the heijunka box every 15 minutes, took the eight slips from the slots corresponding to their names and time interval, and got the needed items with their carts. By distributing orders evenly throughout the day, the heijunka box allowed resources to be used more efficiently.
Basic rules were established for loading the box. Orders cannot be split apart to get the required eight items. (So, an order with seven items would go into a slot with an order for one item. It couldn’t be distributed as four items in one slot and three in another.) However, since the average order was two line items, several orders could be loaded into each slot to get the requisite eight items. Also, two time slots could be combined to distribute the work in multiples of eight. (Thus, two orders with seven line items and an order with two items could be loaded into a time slot. The download operator would put a blank card in the following time slot, giving the picker two time periods to fill two orders. )
Why 15 minute intervals? The team could have used 12 minutes, since there are five 12-minute intervals in an hour. However, breaks were 15 minutes, so that interval was more natural to people. “It was a good period to work with,” said Duncan. To keep the heijunka box a manageable size, it was built to hold 120 minutes worth of work (eight 15-minute intervals), instead of an entire eight hours. The time intervals were written on magnets attached to the top of the box and were updated every two hours.
Why eight line items? “We began with five,” explained Duncan. “We didn’t know any better, and we didn’t’ have any idea what was going to work. When we got to the point that most of the pickers were getting back early from picking, we tried six line items after talking it over with the operators. We just gradually increased it.”
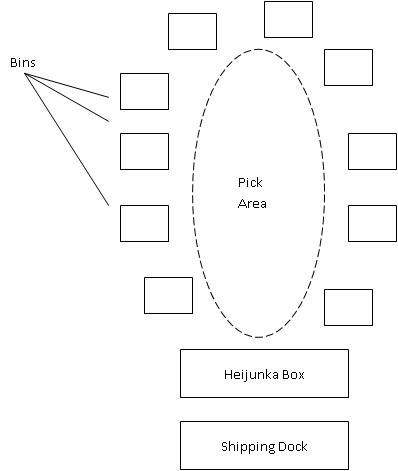
The team also reconfigured the physical layout of domestic shipping. (See diagram above.) Bins with items representing 92 percent of orders were relocated from warehouse aisles to the perimeter of an oval-shaped picking area, near the shipping dock. The heijunka box was positioned at one end of the oval, a few steps from the dock and the open doors of delivery trucks. After removing line items from the heijunka box, pickers selected products from the bins arrayed around the oval, placed them on carts, and wheeled them to the assembly station where they scanned and packed the orders and put them in a queue for final processing at the nearby freight station. (Stations were located within the pick area.) Freight weighed the orders, generated shipping labels, and put them into a waiting truck. Under the new system, lead time for shipping an order dropped from 367 minutes to 136.5. Processing time remained the same. The number of pickers needed fell from 16 to 10. The extra people were reassigned and a few, who did not like the new system, left.
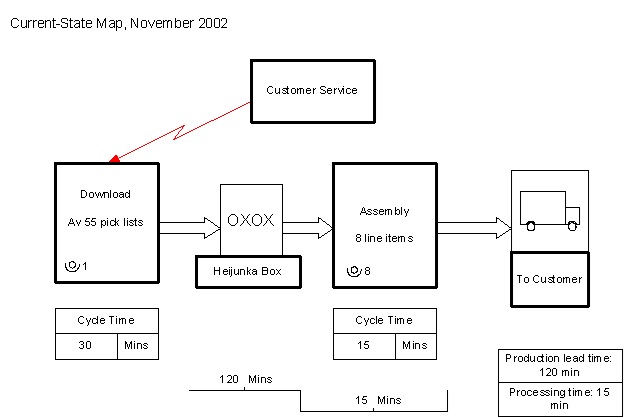
The team wasn’t finished. In November 2002, it designed a leaner process by figuring out how to combine the assembly and freight stations, as illustrated in the above map. One improvement was modifying the tabletop freight scales to accommodate packing and weighing. Another was introducing prefabricated boxes that pop into shape. This eliminated the need for pickers to construct boxes with tape, except to seal the top shut. Pop-up boxes cost more, but the expense was offset by savings in time and labor from combining two steps, explained Duncan. “For a while we were even using the label to seal the box, but UPS didn’t like that,” he recalled.
Several such assembly stations were aligned down the center of the oval so pickers didn’t have to wait to process orders. After processing, they loaded orders into a truck. They turned around, took the next eight line items from the nearby heijunka box, and began the next cycle. “They finished at the same place they started,” said Duncan.
Once the new physical process was designed, managers calculated how many people were needed to do the picking, based on work content (the actual time needed to do the work). They figured out the average number of line items received in a week and divided it by 32, the number of line items picked in an hour by one person (eight line items every 15 minutes). The result was a typical week’s worth of work expressed in man-hours. This number was divided by a picker’s available time (excluding time for breaks and team meetings) per week. The result was 7.35 pickers. Shipping decided to use seven. The extra people were reassigned. “The .35 is made up by the team leader and the download operator,” explained Duncan. If the fraction were over .5, he would have authorized hiring an eighth person.
Box Score of Results for Domestic Shipping Improvements
| June 2000 | November 2002 | |
| Shipping employees | 17 | 10 |
| Re-stock clerks | 4 | 2 |
| Operation hours | 10 a.m. – 10 p.m. | 11 a.m. – 7 p.m. |
| Lead time | 6 hrs. + | 1 hr. (orders placed by 6 p.m. ship at 7 p.m.) |
| Distribution expense (as a % of sales) | 1.84% | 1.31% |
After hourly employees were trained in value-stream mapping, they found a way to improve the process again. An employee suggested rearranging the oval picking area so the highest volume items were in two compact zones nearest the heijunka box and delivery trucks. A picker assigned to each zone took line items from the heijunka box, filled, packed, and loaded orders within an area 16-feet long. Because of the improvement, the zone pickers processed 15 line items instead of eight every 15 minutes. “This was a result of bringing the training down to the hourly level and letting them run with it,” said Duncan. “That’s where the good ideas come from.”
The good ideas will be coming from more and more areas of the company. “There is a full commitment to become a lean enterprise and take lean thinking and principles throughout the whole organization and out to our suppliers,” said Bussell, the global operations vice president. “That’s a commitment written into the objectives of senior management.”
Related book