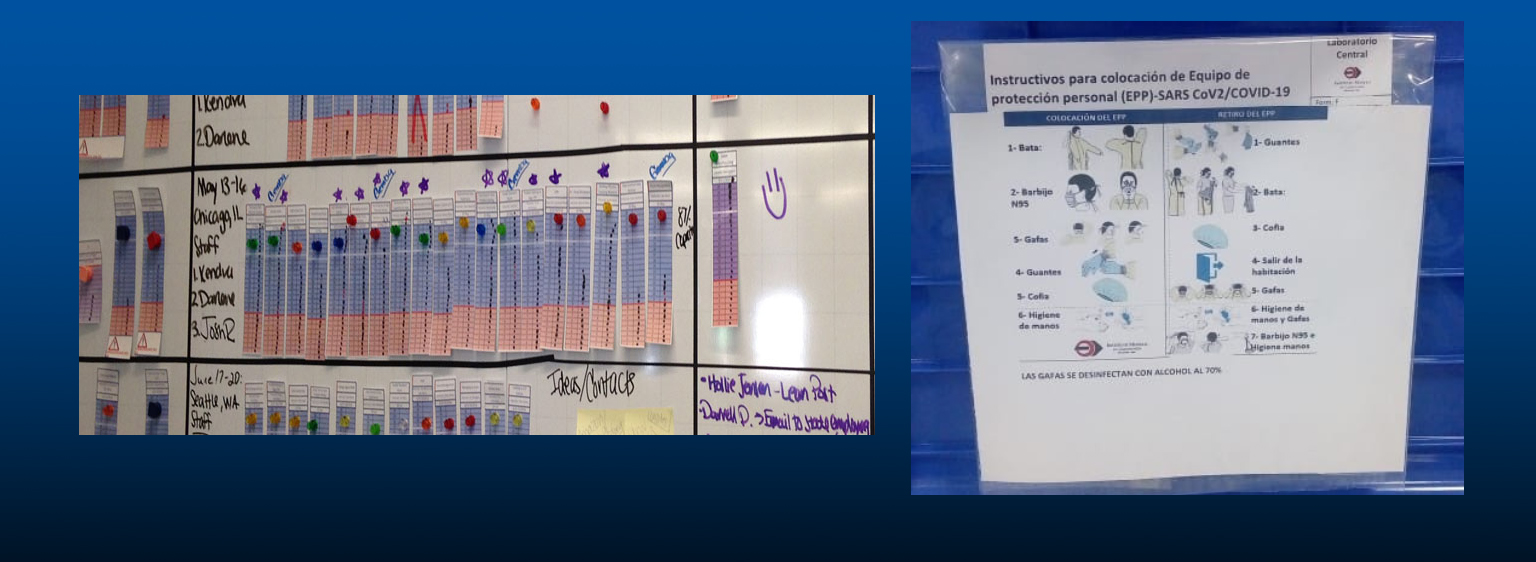
I strongly prefer starting with a basic handwritten approach. Keep it simple and focus on the improvements you are trying to make, not on clever graphics. As you proceed, you can always automate your visuals, but fussing with that when you’re starting will only distract from the actual process improvements you are trying to make.
The real questions are: Why are visual controls vital to continuous improvement in the first place, and how can you use them to motivate your workforce and lead dramatic performance improvements and culture change? What types of progress do these visual controls track?
Ultimately, these questions expose the fundamental differences between lean and traditional management. Visual controls will reveal how traditional companies organize work into functional departments or equipment types, such as the drilling department, the punch-press department, and the like. In these companies, nobody (except for final assembly) is involved in producing the final product, just component parts. Also, the various departments operate from a production plan based on a forecast of what customers might want. The operations team never sees the actual demand. Finally, there’s no point in seeing or visualizing the entire process because nobody understands how their work relates to others’.
An accurate visual depiction of a traditionally managed company’s operations would reveal waste everywhere. For example, you’ll see various departments’ machines running at different speeds with different changeover times. A traditionally run company will simultaneously produce 200 bases and 1,000 covers, with the excess absorbed into inventory. Such an operation creates long lead times of six to eight weeks and enormous amounts of excess inventory, which results in low inventory turns. These wasteful operations are hard to map, except perhaps at final assembly — which explains why you rarely see much visual control at a traditional factory. More importantly, what, for example, would the visual control for 200 bases and 1,000 covers really tell you? You might learn that you made 800 excess covers, but if no one cares, what is the point of tracking it?
Improving Performance with Visual Management
By comparison, when you shift from traditional to lean management, you will see how all these dynamics change. For example, moving from functional departments to value streams, where you position equipment to achieve one-piece-flow cells, enables you to make a complete product from raw material to a finished deliverable in minutes, not weeks. Or the move from a philosophy of “the bigger the batch, the lower the cost” to “sell one, make one” gets everyone on your team as close as possible to the customer — the lean ideal. To approach this ideal, you must introduce the concept of takt time, a production cadence linked to the beat, or rate, of customer demand, where you match the cycle time to make the product to the takt time of customer demand.
Making the complete shift to takt time establishes visual control as a high priority, because it will help you fully grasp your production pace and respond in real time. If, for example, your takt time is 60 seconds, and the shift is eight hours with a half-hour for lunch and two 15-minute breaks, then your actual work time is 420 minutes. So, to keep up with customer demand, you must make 420 pieces every day. When you set up and staff the work cell to work at the takt time, you will have no room (other than overtime) to make up for a late start or a breakdown. To have any chance of meeting the daily production goal, you need visual controls that tell you what the plan is and whether you’re achieving it hour by hour.
You can display this information on a simple flip chart filled out each hour by the operators or the supervisor. It might look like this:
| Time | Production Plan | Actual | +/- | Comments |
| 7-8 am | 60 | 50 | -10 | Slow start |
| 8-9 am | 60 | 60 | — | N/A |
| 9-10 am | 60 | 40 | -20 | No boxes |
This approach serves several purposes. It tells everyone whether they are on track and alerts the supervisor to make corrections when they are not. The comments section indicates the possible root cause of problems, which helps stop them from recurring. This information essentially brings customer demand directly to the shop floor, ensuring everyone feels the pressure of the customer.
Motivating Teams with Visual Management
And most importantly, this essential information brings the operators together as a team to meet customer demand. The motivational factor of visual management is exceptional; you should not underestimate it.
At one Wiremold plant in China, we made surge protectors and GFCI wall plugs, employing eight to 10 cells to make these products on different sides of several aisles. Each cell used an hourly visual control board like the one above. They also used a simple flag system with a green flag marking when things were on track and a red flag indicating when things were off. Raising the appropriate flag every hour signaled the current state to the supervisor, who could see all flags merely by looking down the aisle. These simple visual controls indicated problem cells in real time, prompting us to fix them as soon as possible. We didn’t need to spend money to computerize this or create fancy displays. Simple and cheap worked just fine.
We didn’t need to spend money to computerize this or create fancy displays. Simple and cheap worked just fine.
Let me share a few other examples of the motivational power of visual controls on a team. Years ago, I was on the board of a jewelry manufacturer in Miami. They asked for my help adopting lean production, and I helped them create a one-piece-flow cell that reduced the time to produce a ring from eight weeks to two days. Launching the cell was a bit bumpy, and we struggled to make the initial goal of 260 rings per day. We addressed our problems one by one and installed a large visual control board to track hourly progress, which all 13 operators in the cell could see. Late one day, I was in the office when a big cheer went up from the cell. They had broken through and produced 300 rings. They went on to hit 350, then 400, and eventually settled out at a steady 450 rings per day, with a big cheer going up every time they passed a new milestone. There was no separate bonus for this — just the motivation of the visual control board and the natural competitiveness of the team.
The same company had a sister plant in Mexico dedicated to the final finishing of the rings. When I first went there, the whole plant produced 450 rings per day, and there was a lot of operator downtime. We organized production into six cells of 13 people each and put up big hour-by-hour visual control boards. We also added a team incentive, paid in Mexican food stamps, for making takt time each day. At the end of each hour, everyone would check to see where they stood and then look to see where the other five teams stood. A little competition never hurts. The net result was that, before long, each of the six cells made 450 rings per day versus the 450 for the whole plant before lean production practices.
Visually sharing crucial process data motivates employees in every setting, including salaried employees in office environments. I discovered this while serving on the board of a life insurance company that, at the time, was taking 48 days on average to respond to a request for insurance. When we investigated the cause of the lengthy process, we found many of the usual suspects of a traditionally organized company.
A primary problem was the lack of a simple value stream to process the claims. Adding a visual board helped us tackle this. At the time, the company organized the underwriting department so that underwriters sat near case managers who assisted them. However, the underwriters and case managers reported to different managers. When we started, an underwriter was underwriting 15 lives per week on average. We formed a cell with one underwriter and four case managers, making each case manager responsible for giving the underwriter one fully detailed case per hour.
This approach was all new to them, and there was some complaining —which changed to an outright uproar when I made them display an hour-by-hour visual control board. They complained that “this is very unprofessional.” But they quickly discovered that this worked. The cell could process applications in less than 20 days, and each underwriter was underwriting 88 lives per week.
Understanding the Broader Benefits of Visual Management
The underlying case for visual controls applies beyond a particular product line or business function. We found that following the lean model of “sell one, make one” meant we couldn’t tolerate any machine breakdowns or broken tools in the tool room, which could take three weeks to repair. So, we started managing maintenance visually, creating regular (daily, weekly, and monthly) maintenance routines for all our equipment. We tracked this work with a simple peg board with colored golf tees to display the current state. We even created a report card that traveled with each die, which the small inspection/repair team used each time it inspected and repaired (if needed) every die after every use.
Furthermore, we ran the entire factory with visual controls in the form of kanban cards. We could do so because we shifted from producing according to a pre-established forecast to initiating production by kanban. We assigned a kanban quantity — a full pallet, half pallet, or even a box of 10 or 20 — to each SKU. As customer orders came in throughout the day, we printed a kanban card right on the floor next to where we produced the product each time an SKU reached a predetermined quantity of orders. That card trumped all our production plans by immediately signaling the team to make that product next.
Keeping Visual Management Simple
How you produce your visual controls (computerized, hand-drawn, or even with sculpting clay) matters far less than fully understanding how your production system operates and how visual management supports your key lean ideals. Your visual controls won’t matter if you produce the traditional way, in batches to a forecast. When you move to lean and one-piece flow, you can tap any form of visual management to track how well you are working to takt time. There is no time to make it up if you don’t.So, I suggest starting with simple manual visual controls such as flip charts, flag signals, red or green lights, and maybe even golf tees on a peg board. As you progress, you can move to more automated computer-controlled visuals. However, if that’s what you want, always do an initial cost-benefit analysis to ensure it will be worthwhile. Keep it simple stupid!
Building a Lean Operating and Management System
Gain the in-depth understanding of lean principles, thinking, and practices.


Thanks Art. What about the reward of achieving goals? Based on visual management.
What is your the suggestion?
Carlos, I prefer rewards that are based on the whole business experience and involve everyone. Profit sharing for example works very well with lean. You can use visual management to reward a particular team based on achieving their goals but I would be very careful about doing this as it can lead to some infighting. After all not everyone will be on a team with clear visual management although they may contribute to that teams result. Better to stick with rewarding everyone based on the total business results.