A question that frequently comes up in applying lean thinking to accounting and finance is, how do we understand and make the best use of the capacity – skills and time – of accounting team members? To answer this question, we consider the lean wastes of overburden and neglect (not making the highest and best use of staff capabilities). Then we can make a critical connection between our accounting professionals’ valuable capacity and how effectively the organization is benefitting from it to drive improved performance.
In transactional work, whether it’s the work of an assembly specialist in an automotive plant or an accounting specialist processing payables, we can look at the transaction cycle time and number of transactions and compare them to the available work time to make capacity visible. For many accounting teams, however, the work isn’t limited to a single, self-similar set of transactional work from one day to the next. The tasks may be the same (e.g., analysis or reconciliations) but may take more or less time depending on the content, scope, or requirements. There may also be a variety of tasks, some recurring and some ad hoc, that the accounting team needs to fit into its daily work. So, how can we get a handle on the accounting team’s capacity and make it visible, so we can avoid invisible overburden?
Rather than a technical discussion of various measures of capacity, and to avoid the less-than-satisfying answer, “it depends,” let’s look at an example (drawn from actual case studies) that ideally can be translated and adapted to different types of teams and work responsibilities.
Studying a Team with Diverse Responsibilities
Our example is a finance and accounting team with very diverse responsibilities, including financial planning (budgeting, forecasting, and variance analysis), decision support, business case analysis, various month-end close tasks, various regulatory reporting responsibilities, and monthly management accounting reports. Some of the work was recurring; some of it was ad hoc or on-demand. Members of the team felt overburdened, and their internal customers wanted to be able to get reports and analyses in a more consistently timely fashion. Customer requirements were also changing as the organization was adopting lean thinking, and the team needed to be able to evolve their products and services. The team and their leader were challenged with making the work visible in a way that would help the team plan for and manage the timely completion of work without adding unnecessary administrative waste to their already full plates.
The team’s initial reaction was that all of the work is different, that ad hoc work cannot be planned. There was significant resistance to doing time studies because of the administrative burden and, even more so, because of a lack of confidence that they would be helpful. Over time and a series of experiments, they developed a system that allowed them to organize, measure, and plan their work. These are the elements of the system as it evolved:
- Ad hoc analyses. The team regularly received requests for analysis, and the scope could vary from quick data-pulls to complex cost–benefit calculations. The team developed a standard intake process that organized ad hoc analyses into either simple tasks requiring less than four hours to complete or more complex tasks taking more than four hours. Anything less than four hours was taken on as “Core Work” – a category discussed in more detail below. These tasks did not need to go on the capacity visual individually.
For any request estimated at over four hours, the team logged it on the capacity tool, and the lead analyst completed a project intake tool. This process recorded an estimate of the amount of time per week and how many weeks the analysis would take. At first, these estimates varied significantly from the actual time required to complete the analysis. With experience, however, the staff got better at estimating, and since the team updated the visual in real time, they could adjust as they got further into the work.
Estimates needed to be to the nearest four-hour block (0.1 FTE); nothing more granular was used. In addition to improving estimates, completing the intake tool became an efficient, seamless part of starting any analytical project (and was designed to clarify information that made the analysis itself more efficient). At any given time, the team worked on around 40 active individual projects. - Recurring reports. Each team member had several recurring reports they were responsible for producing (when this work began, the team delivered over 400 recurring reports per month). They all completed time studies of the reports they were responsible for, capturing this information as a fixed monthly commitment of their capacity. Since these were recurring reports, there wasn’t a great deal of variation in the time it took to produce them from one month to the next. But the number of reports produced per individual and the total time it took during their workweek varied greatly from one individual to the next, so this was very helpful in understanding both individual and overall capacity and opportunities to level-load report production. It also ultimately provided opportunities for the team to reduce the time spent on recurring reports through several improvement projects.
- “Core Work.” Each team member completed a one-week time study of the amount of time they spent in meetings and on email and phone calls not related to a specific project, which included responding to ad hoc requests that didn’t meet the four-hour threshold to be individually logged on the team’s visual. This time also was noted as a fixed amount on the capacity visual. It was updated periodically when the team felt that the previous time study no longer reflected the current workload.
- Vacation. The team included a way to capture vacation time in the forward-looking capacity analysis so they could incorporate it into project and workload planning for the upcoming weeks and months.
- Professional development. Before developing and implementing this capacity tool and management process, the team expressed frustration with expectations that they pursue continuing education and professional development as part of their work. Because there was never time available during the workweek, they had to do it during evenings and weekends. Making capacity visible and implementing a management process to plan and level the work allowed the team to carve out dedicated time during the workweek to pursue their professional development. It also allowed for project assignments to align with development goals so team members could work on projects that involved skills they wanted to learn or further develop – often in partnership with a lead or mentor on the team who was already highly skilled in this area.
This capacity management model, process, and visual tool allowed the team to look three months in advance, identify individuals on the team who had a heavier vs. a lighter planned work burden, and find opportunities to level and support the work differently. Together, these benefits helped the team produce deliverables on time.
Visualizing Capacity
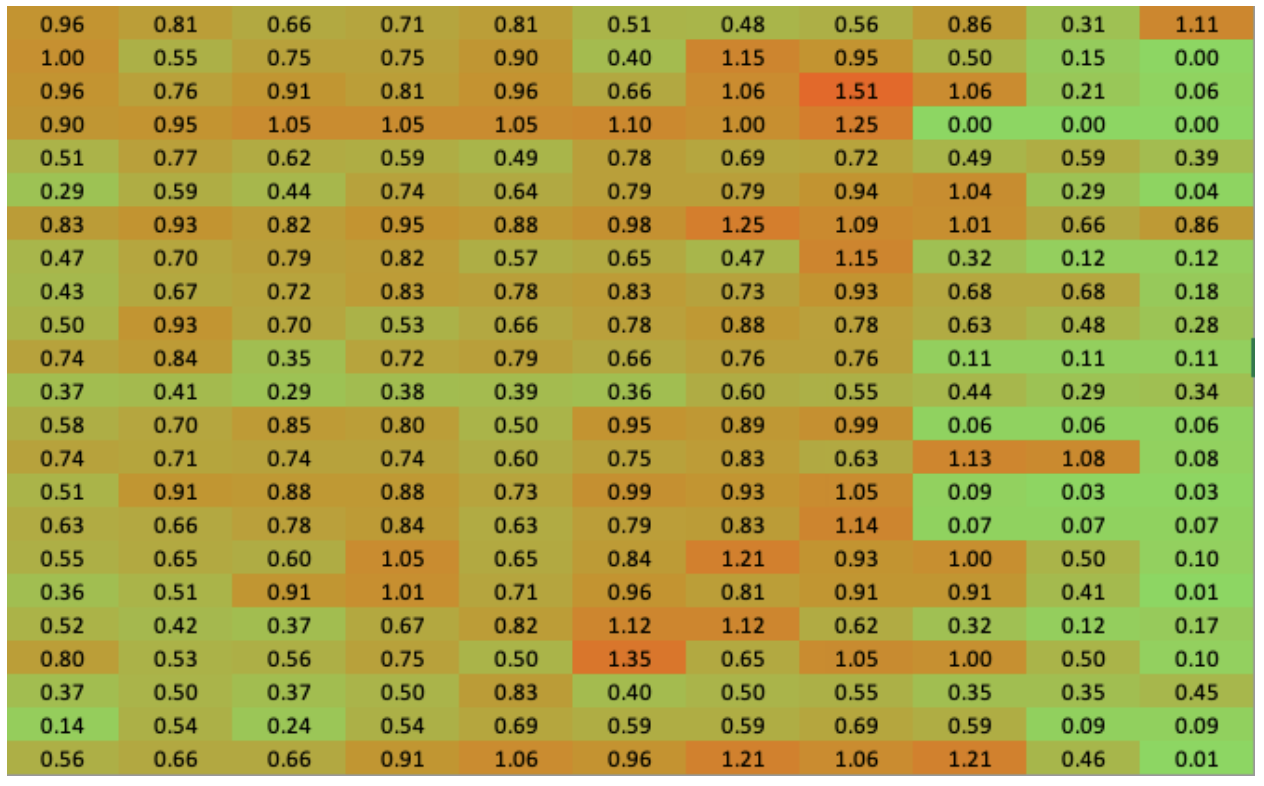
In the following sample visual, each row is an individual staff member. The first eight columns are historical data (including the current month), the last three columns are the future month forecast. The data represent FTE (note that it’s possible for an FTE over 1.0, reflecting significant overburden). More orange represents a higher workload, while more green indicates available capacity.
The Benefits of Making Capacity Visible
Once the management model, process, and visual tool were in place, the team took on fewer tasks and projects simultaneously, but work moved through more quickly overall. The result is not exactly single–piece flow, but visually managing the work-in-progress helped the team increase effectiveness, efficiency, and staff satisfaction. The management team had a weekly planning huddle during which they checked near-term deadlines and reviewed the team’s capacity overall to make adjustments to level the work. If work was not on track to meet a deadline, the management team was able to develop countermeasures and involve and support staff in getting it back on track. The forward-looking visual helped with the assignment of new work and ensure that no team member was overloaded with projects, which had happened in the past and contributed to analyses taking longer than expected to deliver. Making the work visible and using it to level the work across the team also brought revealed cross–training opportunities that weren’t previously evident.
This example demonstrates how a Finance and Accounting team used lean thinking to make capacity visible, which, in turn, helped it better manage workload and deliverables, reduce individual work overburden, and improve the team’s ability to use their skills fully. There are certainly many other examples; hopefully, this one can spur a discussion and sharing of other ways accounting teams are making the best use of their skills and time.