An invaluable use of extended value-stream mapping is to track the path of all of the essential parts that go into delivering a product to a customer, from raw material to delivery. The picture that emerges will show the consequences of the manufacturing and sourcing strategy that guided the design of the product and its supply system.
But, more importantly, an examination of the current-state system as a whole may reveal opportunities for rethinking the global configuration of the supply system for the next product generation, which is the point at which it is easiest to make a significant leap to an ideal-state configuration.
This case study expands the scope of value-stream analysis to all the value streams supplying materials for a complex component. The value streams include every supply system through and between each facility along each value stream. This entire system needs to be as lean as possible. The question that emerges once the lean practitioners complete this analysis and have improved the value streams is where, across the world, they should locate each facility. Answering that question was the key task of the ideal-state analysis presented for this value stream.
Seeing the System
When a global automotive supplier of a forged, machined, and assembled component delivered to an auto assembler in the U.S. began to design the next generation of its product, the firm took a fresh look at the supply system for all the key sub-components back to raw materials.
It assembled a cross-functional team from operations, procurement, supplier development, planning, and finance to collect the data and map each value stream in the current supply system using the methodology described in the Seeing the Whole Value Stream workbook. Then, they posted the maps on a big wall in their procurement department to analyze them. In this case, many of the facilities were part of the same corporation, so the cross-functional team was able to get most of the information they needed from internal suppliers.
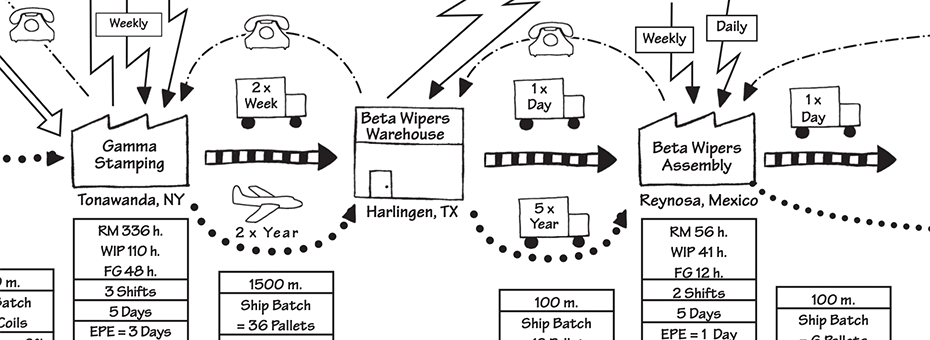
The completed system-level map, which covered a whole wall, contained similar data boxes to the current-state maps for the product: recording processing time, raw materials, work-in-progress, finished goods, transport time, transport batch size, delivery schedule adherence, production batch size, changeover time, production interval, yield, parts per million, demand amplification, etc., for every activity.
Creating a System-Summary Map
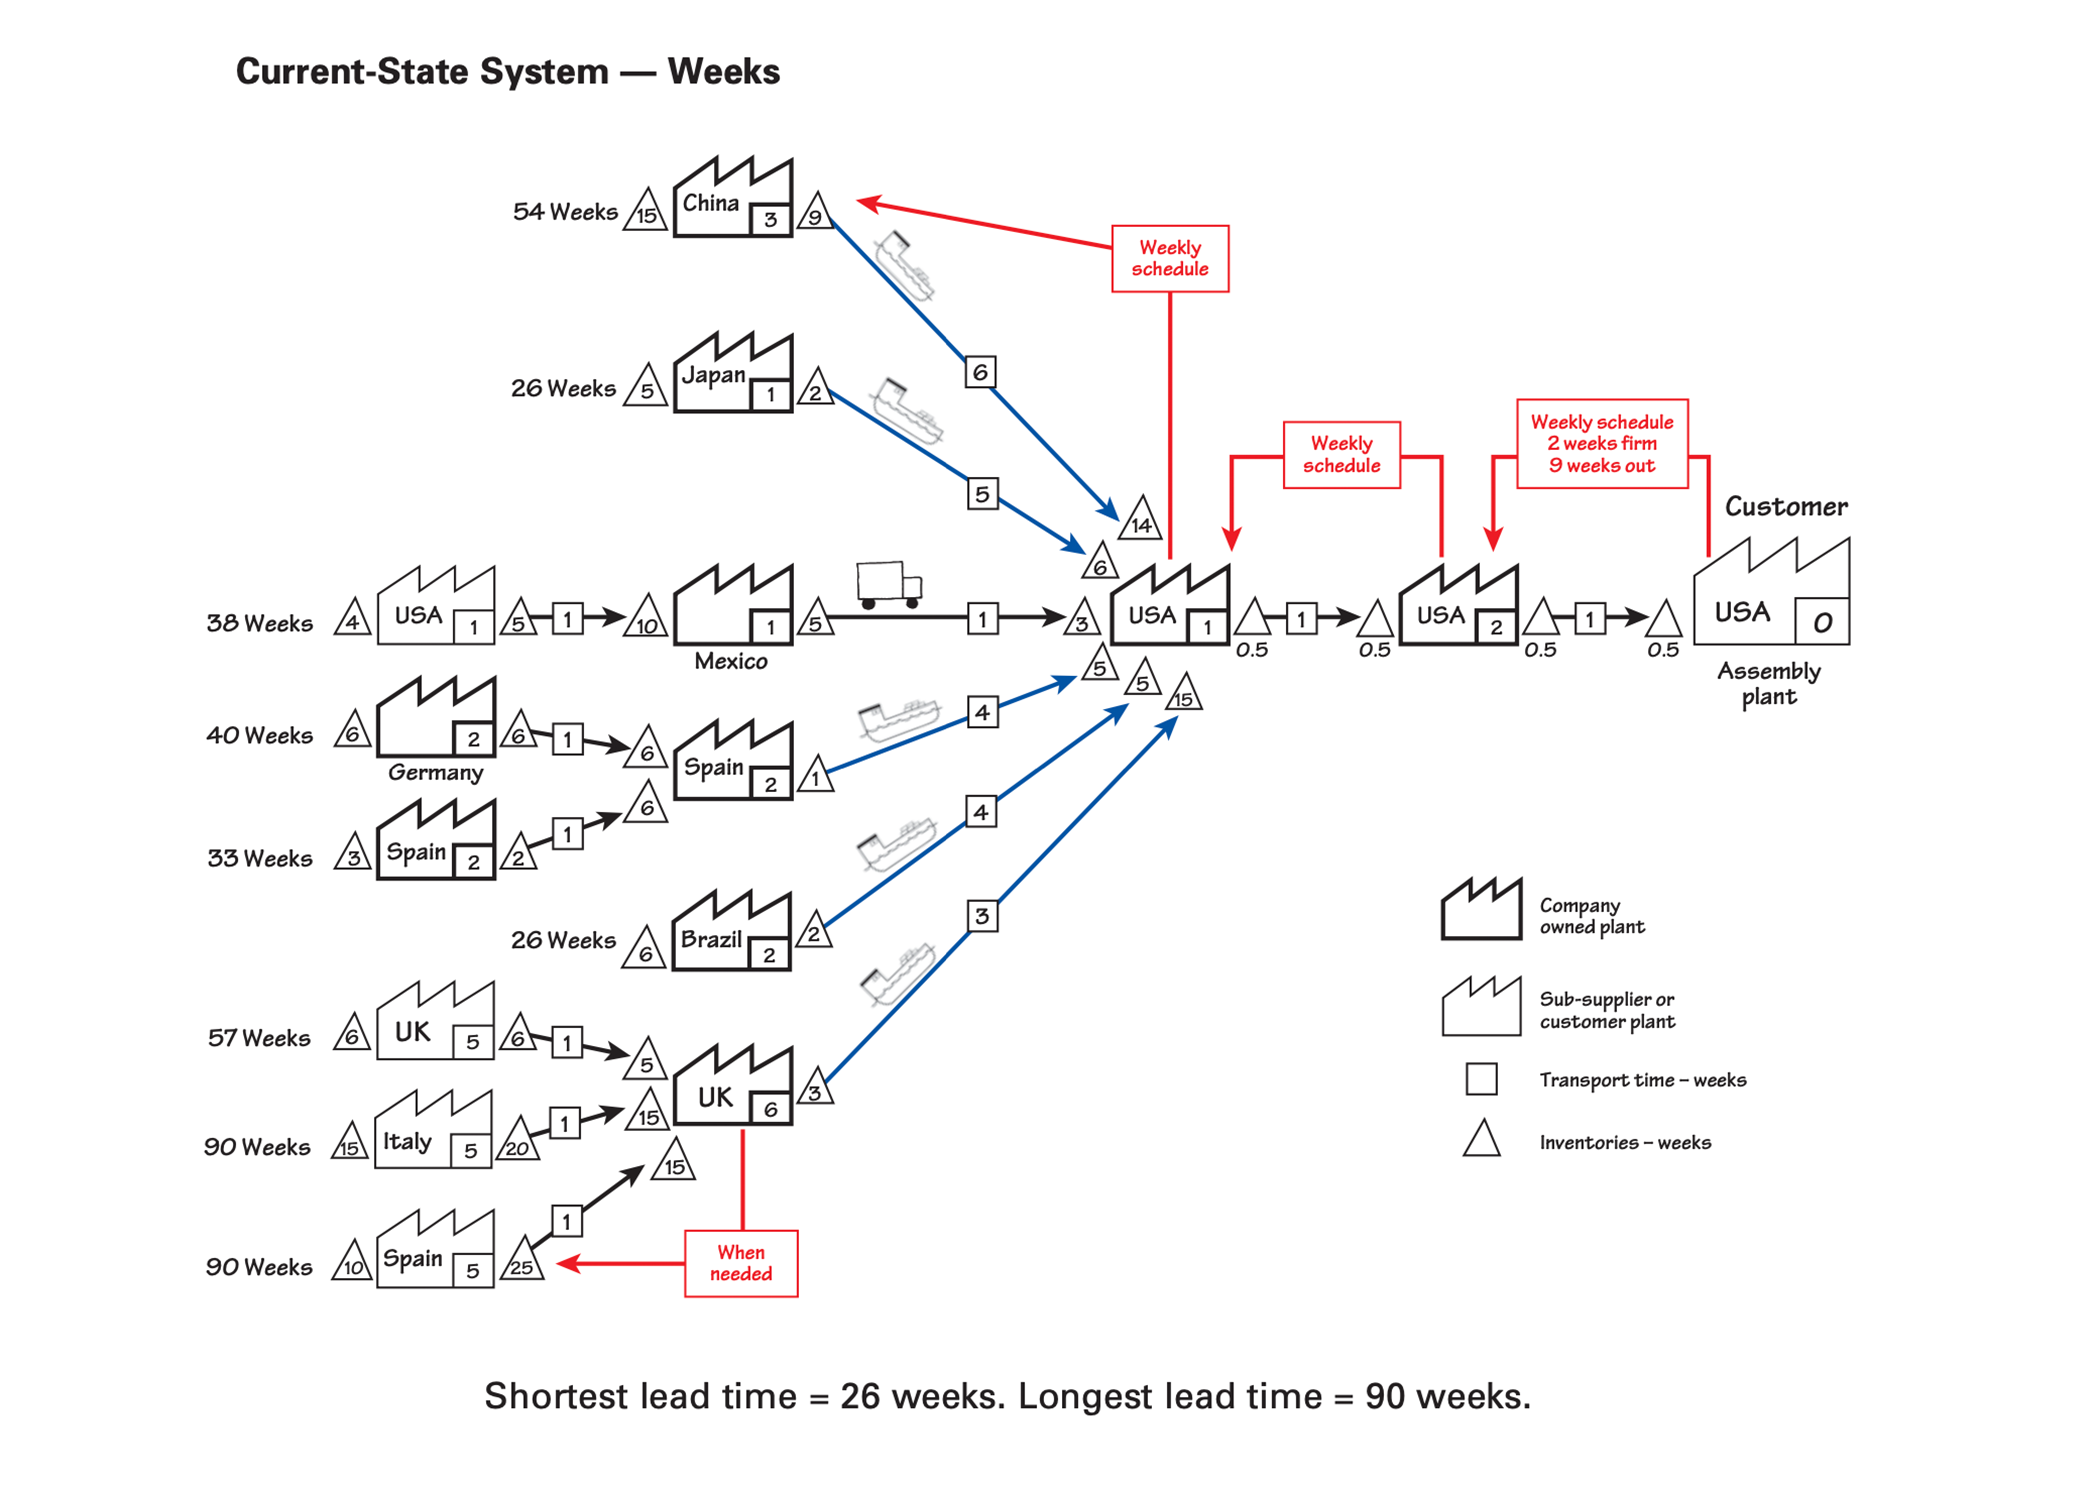
It is easy to get lost in all this detail, so it is beneficial to summarize the system’s main features in a system-summary map (as shown below). The system-summary map illustrates the primary timelines (the amounts of raw materials, work-in-process, finished goods, and transportation time) needed for each of the extended value streams in the supply system and the primary information flows that trigger these activities. Also included is a summation of the total lead time for each value stream.
Analyzing the Information
The conclusions they drew from the detailed analysis of each value stream on the wall and the system-summary map were:
- The critical parts for this product are made in 14 factories in nine countries on four continents and necessarily travel thousands of miles on their journey to the customer.
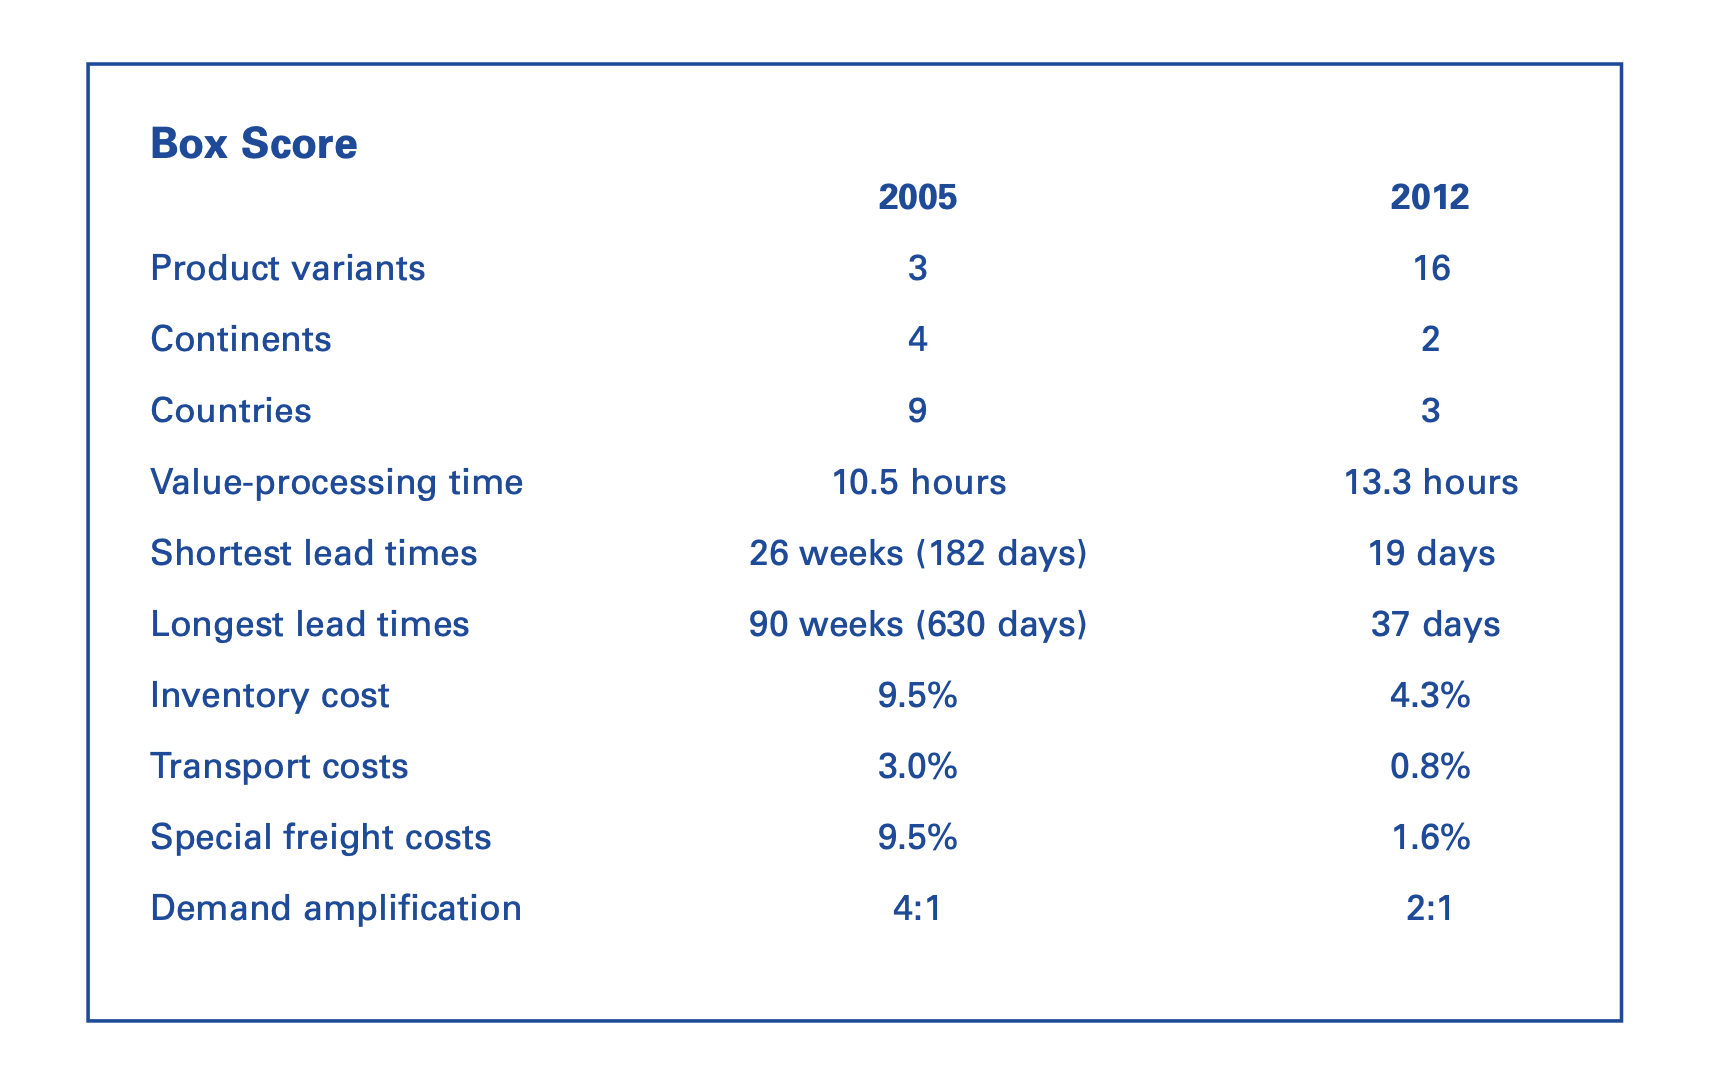
- It takes between 26 weeks (182 days) and 90 weeks (630 days) to perform the 10.5 hours of processing time to forge, machine, and assemble the part.
- The cost of all the inventories along the value stream totaled 9.5% of the total contract value. Once you have a delay, the customer builds this into their safety stock for the life of the program.
- The cost of special air freight to respond quickly to changes in demand from the customers was also 9.5% of the total contract value, while all the transport costs were 3.0%.
- A lot of top management time was spent responding to and sorting out issues and problems with the customer and distant suppliers, many of which were part of the group.
- Information flows are difficult to align across cultures, with different timings, languages, and information systems.
- Supply streams crossing currencies carry a much greater risk of windfall gains and losses.
- Long lead times also make it harder to introduce new product designs, accompanied by difficult discussions on who will bear the cost of obsolete stock in the pipeline.
These long lead times, extra shipping costs, and extra inventories reflect this firm’s decision when it first configured the value streams. Its goal had been to create large “focused factories” to gain scale economies in each manufacturing step (forging, machining, and assembly in this case). The scale imperative, in many cases, resulted in the selection of one plant to perform a given operation for products delivered to customers worldwide. The other key element in location strategy when the company configured these value streams was to utilize low-wage labor whenever possible in China, Brazil, and Mexico for customers in high-wage locations. The advantages of large-scale and machining efficiencies at company plants in Germany, Spain, Japan, and the UK and of low wages in China, Mexico, and Brazil had been judged more important than the disadvantages of long lead times, lack of responsiveness to changing customer demands, and high in-process inventories.
Seeing the Value Stream, End to End
The current-state map combining many value streams caused a lot of discussion, debate, and analysis, which did not please some of the managers responsible for creating it. However, once the system map was on the wall, there was no getting away from thinking about this supply system as a whole in light of the new-generation product they were planning. The result was many questions, starting with why the lead times were so long. So, once the team began to ask why all the delays and inventories were necessary, they began to see the most significant opportunities for an ideal state for the next generation.
First, it was clear that there was still scope for reducing batch sizes and speeding the production flow in plants where work-in-process inventory was less than two weeks. However, the best opportunities lay in the plants in China and the UK, plus those plants supplying the UK; this is where the team decided to focus their internal plant-level lean activities.
Still, to improve lead time further, they worked with their shipping companies to reduce shipping lead times from six to three weeks.
The system-level map also provoked analysis of the information flows that trigger this physical flow in terms of batching, lead times, and volatility. For example, how much did customer demand vary and why? And how much system-driven amplification was being passed upstream? What was driving the need for special air freight, and how much time did management spend responding to changes in customer demand and supplier shortages?
The system-level map was also helpful for tracking the location of the leading quality problems and scrap. Finally, it also provoked analysis of the costs of running this supply system because it was now possible to see much of the costs, rather than piece price and slow freight costs at one part of the system, the traditional basis for location and procurement decisions.
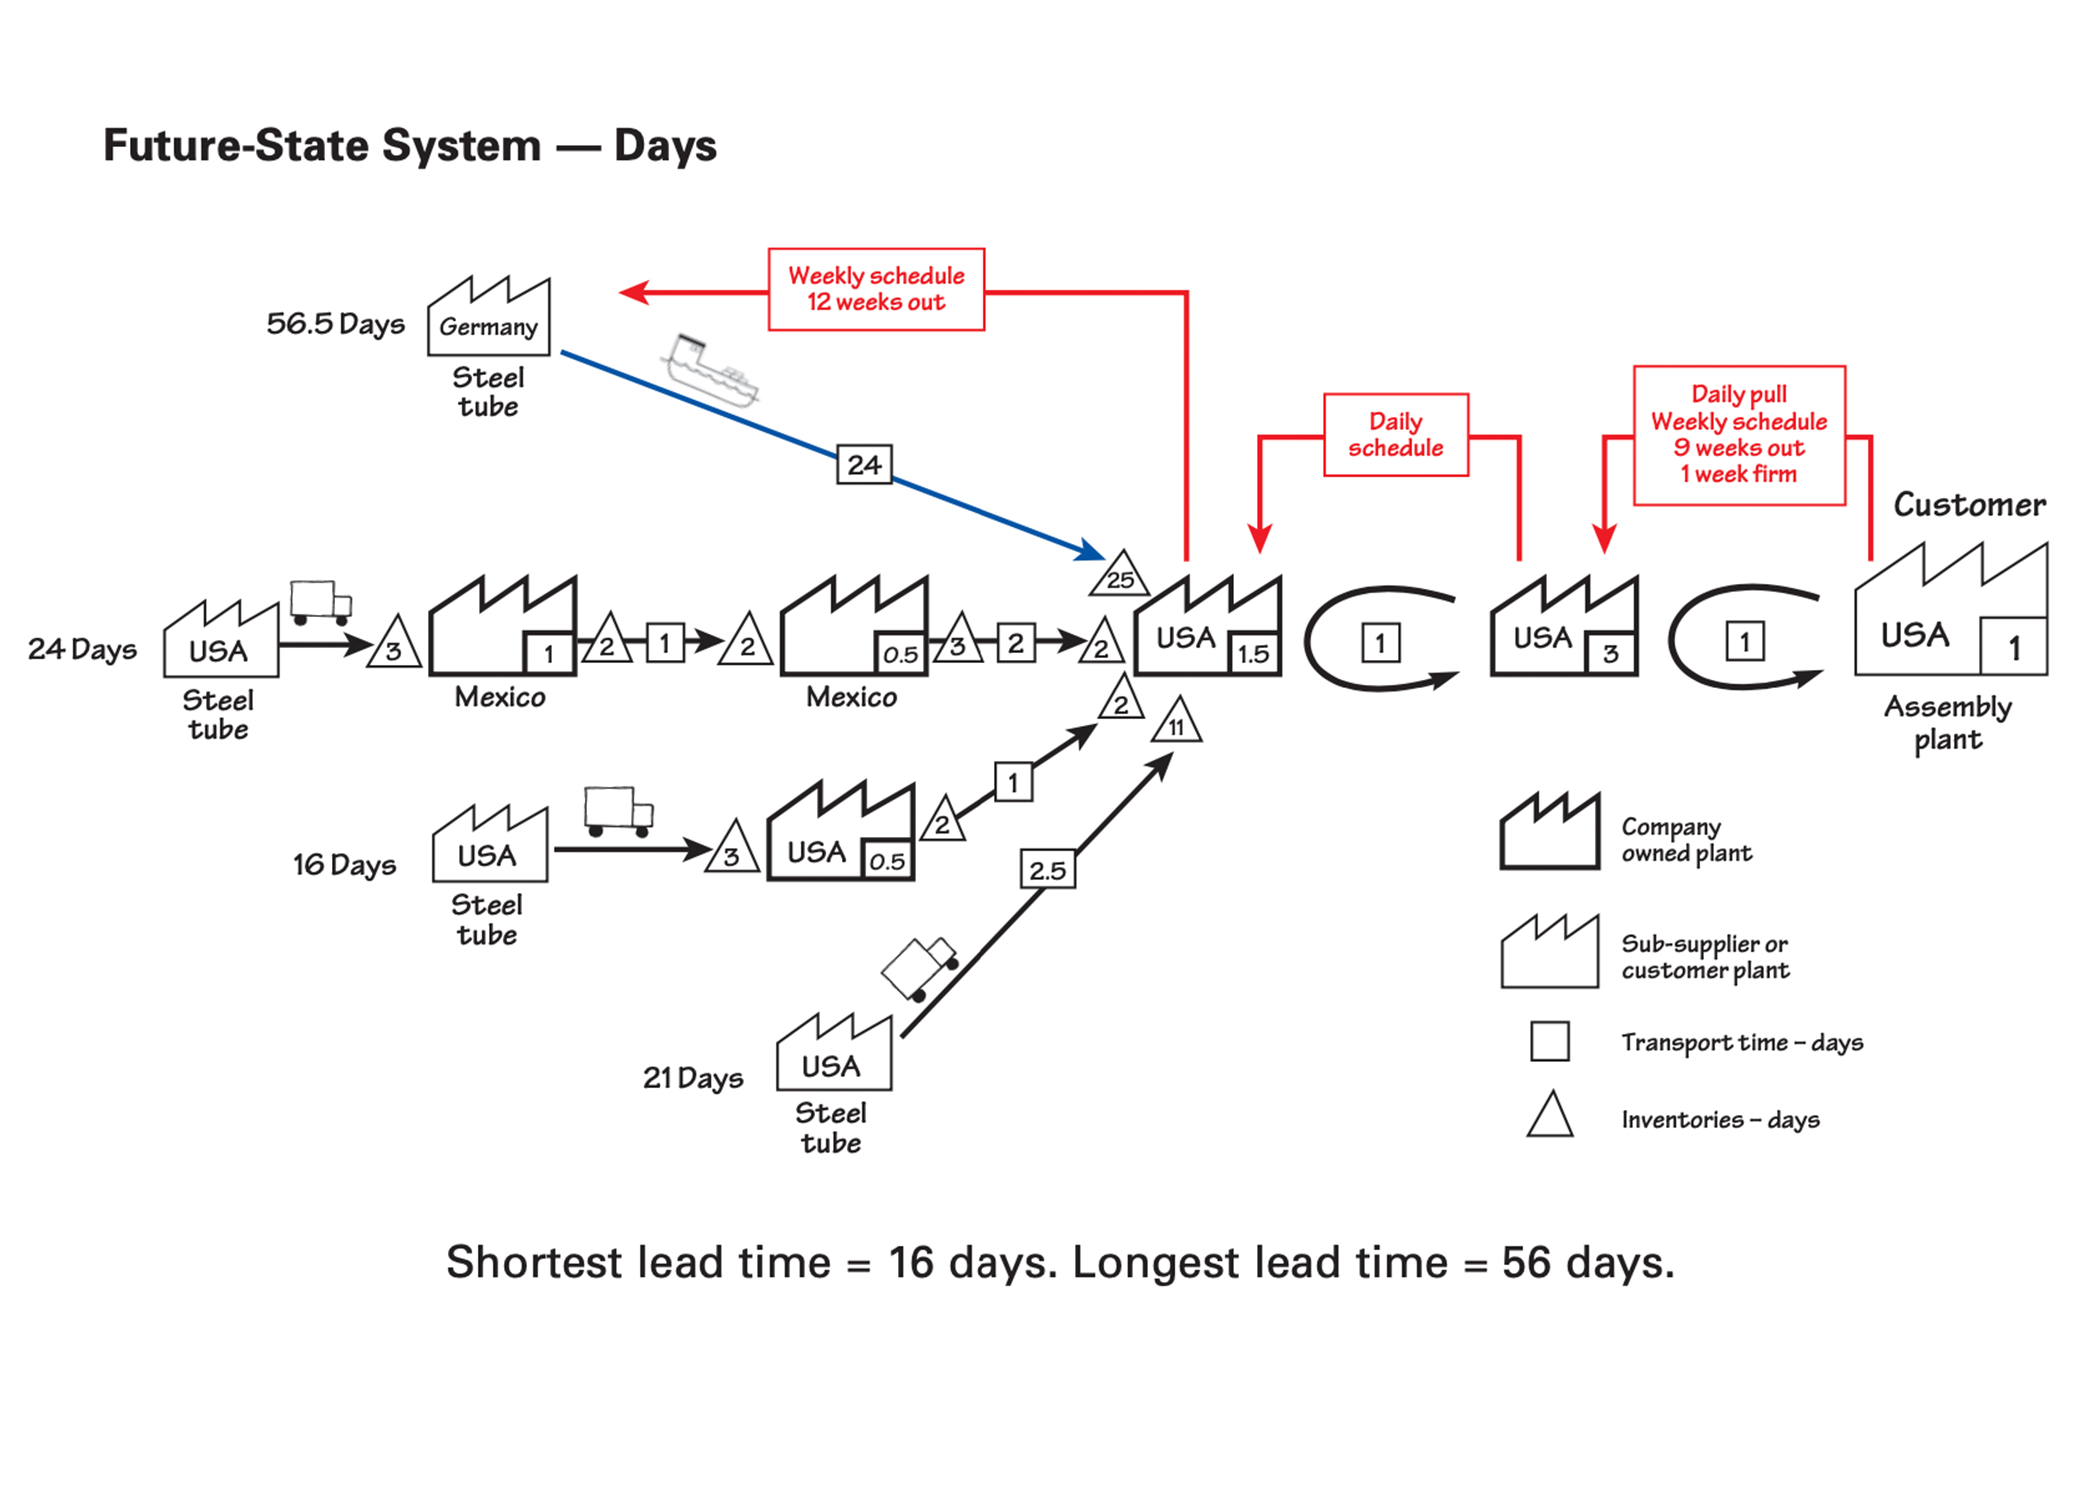
In the end, top management concluded that based on the discoveries of the supply-system team, it needed to rethink its manufacturing and sourcing strategies for the next-generation product. The decision was to trade off wage costs and focused-factory efficiencies against lead times, inventories, and responsiveness by localizing production of the new product within the region of sale.
As a result of this value-stream mapping exercise, this product is now entering production with critical timelines and performance indicators summarized in the future-state map. The difference between the two maps is striking, with only one type of specialized steel tube still being sourced from outside the region, in this case from Germany.
Reflecting on Value Stream Mapping’s Power
Mapping extended value streams at a system level is an exceptionally effective analytic practice for several reasons:
- For the first time, it shows all the participants the consequences of how the current state works and elevates the discussion to consider system-wide goals instead of just optimizing each part of each value stream in isolation.
- Posting the detailed maps on the wall of a meeting room becomes a reference point for all subsequent data and analysis and changes the context for discussions about improving the situation.
- Time is an extraordinarily potent way of summarizing any system’s operations. Delays and inventories in the physical flow are but a manifestation of how well the current system is running. A focus on time guides the analysis of the causes of system variation that lead to overburden and slack; that is, waste.
- Seeing the whole system and the sources of variability that destabilize it helps management to focus efforts on improving the pieces of the system that will make the biggest contribution to improving overall system performance and cost.
Improving a supply stream often involves actions at one place that may add costs and go against individual performance targets there. But these costs are outweighed by benefits at another point in the system, sometimes in another company. Extended value-stream mapping and system costing enables these potential conflicts to be surfaced and resolved, rather than remaining obstacles to cooperation.
About Seeing the Whole Value Stream
Seeing the Whole Value Stream by Dan Jones and Jim Womack provides managers with a proven method for understanding and improving the value-creating process that suppliers share with customers.
By identifying all the steps and time required to move a typical product from raw materials to finished goods, the authors show that nearly 90% of the actions and 99.9% of the time spent in the supply chain’s current state create no value. In addition, the method clearly shows demand amplification of orders as they travel up the supply chain, steadily growing quality problems, and steadily deteriorating shipping performance at every point upstream from the customer.
Applying the method to a realistic example, the authors show how four firms sharing a value stream can create a win-win-win-win future in which everyone, including the end consumer, can be better off.
Seeing the Whole Value Stream provides “a method to understand the current state of a value stream and envision future states that progressively reduces waste, variation, and response time, resulting in lower cost and better value for the customer,” says John Shook, LEI senior advisor.
The workbook emphasizes lean’s true nature as a holistic business system and “elevates value-stream thinking to total-system thinking,” he adds. “Everything is connected, so the practice of point optimization invariably squeezes costs and waste in one location only to find that they pop up elsewhere in the system.”
Editor’s Note: This Lean Post is an updated version of an article published on May 26, 2021, one of the most popular posts about this vital lean practice.
Learning to See Using
Value-Stream Mapping
Develop a blueprint of improvements that will achieve your organization’s strategic objectives.


Use:
• Track the path of all of the essential parts that go into delivering a product to a customer, from raw material to delivery
• Exploring/examining the current-state system as a whole may reveal opportunities for rethinking its configuration
Next product generation easiest point to make a significant leap to an ideal-state configuration
Includes every supply system
• The entire system must be lean
After completing lean analysis you have to decide location
The system-summary map illustrates the primary timelines needed for extended value streams
• (the amounts of raw materials, work-in process, finished goods, and transportation time)
• Include lead times
Value Stream Mapping Power
• Shows consequences of current state and elevates discussion
• Becomes a reference point for future improvements
• Time is an important tool or reference you can use when looking at a system
• Helps management with where to focus energy
My thoughts:
In my time as a student, I have learned much about the psychology of being a supply chain major and working in the field, however, I love how practical value stream mapping is. It has been brought up in my class, but you give a convincing argument why every company should be doing this no questions asked. You provide confidence in a somewhat simple tool that I hope will be very beneficial as I start my professional career. Thank you.