Lean transformation work is difficult and time consuming. Nobody complains about having too much time in the day. Therefore, we need to prioritize our use of methods like A3 problem solving and other ways of grasping the situation. Managers and change agents often err in reacting to insignificant changes in a metric. Or, they declare victory too quickly when a single data point suggests improvement. As I explain in my new book, Measures of Success, when we stop reacting to “noise” in a metric, we can better focus our improvement efforts, waste less time, and improve more. That should be a core principle of Lean management that can help leaders in any setting.
While the heart of most improvement work is based on tracking and responding to meaningful metrics, I’ve seen far too many lean efforts fall short due to confusion about metrics and KPIs. And not simply because people use the wrong measures. What’s worse is that people tend to apply misguided thinking about mining for gold from the cache of data. Donald J. Wheeler, Ph.D., the author of the fantastic book Understanding Variation, says that Statistical Process Control (SPC) is “a way of thinking, with some tools attached.” That reminds me of what people say about Lean — that it’s not just tools, but also a new way of thinking.
Lean thinkers should recognize that SPC charts broadcast the “voice of the process” by creating a language of improvement that calls out meaningful signals that our system has changed significantly. This vocabulary only makes sense, of course, to those who are willing to listen — to investigate data without bias, in a holistic manner, with a willingness to identify and respond to signals, instead of overreacting to every bit of noise in the metric.
Do you use SPC concepts as part of your organization’s Lean journey? Have you discovered this proven, simple methodology to evaluate your metrics and Key Performance Indicators? If not, you might be wasting a lot of time asking people to investigate and react to meaningless changes in a metric. We’re supposed to be opposed to waste, right?
When I started working at General Motors in 1995, we used SPC as a tool. We had SPC charts on the shop floor before we later started emulating Toyota’s “Lean” practices. Production workers gauged parts and plotted key engine block dimensions dutifully on an SPC chart. However, our senior leaders couldn’t see what the charts were really telling us. For example, they refused to let workers stop the line when the SPC chart went “out of control”, saying that the parts were still in spec. They failed to recognize that those moments were lost opportunities to learn and improve; and workers got understandably frustrated (and customers ultimately suffered) when out-of-spec parts later were delivered to the final assembly plant. Workers used the tool, but management didn’t share the way of thinking. That was an unhelpful combination.
What Would Toyota Do?
A few years back, I was part of a group that toured the Toyota truck plant (TMMTX) in San Antonio. A Lean Six Sigma Master Black Belt who was part of our group asked our guide, “Does Toyota use Six Sigma?” The guide said, “No, but we teach everybody the seven basic quality tools.” These tools, which gained popularity during the Total Quality Management (TQM) era, include methods that many might label now as “Six Sigma” – including SPC charts, a.k.a. “control charts.”
In The Toyota Way Fieldbook, Jeff Liker and David Meier wrote that companies should “consistently measure and plot the measures on simple visual trend charts.” The book doesn’t discuss SPC, but instead shows an example of a “trend chart” (a.k.a. a “run chart”) comparing performance over time against a goal. It’s important to compare our performance against a goal, but we should also ask another important question: “Are we improving?”
A “Process Behavior Chart” (Wheeler’s term for a specific form of SPC chart) provides a great way to see if we are improving. A Process Behavior Chart has the added benefit of helping us avoid overreacting to routine variation (“noise”) in the metric that’s not indicative of a change in the system that produces those results. We’ll see examples of this below.
We Can Improve the Way We Measure Improvement
A Process Behavior Chart (or even a simple run chart) provides more context than the methods that I most commonly see embedded in modern-day “Lean Daily Management” practices in healthcare and other settings.
Look at Trends Instead of Making Simple Comparisons to Goals
I often see a leader posting a single data point that represents the most recent day, week, or month. Quite often, this data point is compared to a target and the number is color coded as red (not meeting target) or green (being better than the target). That color coding is, in a way, visual, but doesn’t allow anybody to see trends over time.
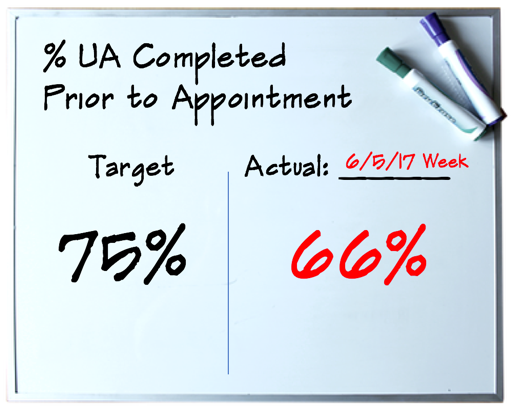
A leader might also compare the most recent number to the previous period’s number, saying that it is “up by X” or “up X%.” However, two data points are not a trend. The factual statement about a percentage improvement doesn’t tell us if that change is signal or noise. A Process Behavior Chart can do that.
Avoid Striking Out with Bowling Charts
I also see many Lean Daily Management boards that display so-called “bowling charts” – dense tables of numbers, usually with color coding. It’s really difficult to see trends in such visual displays, as seen below.
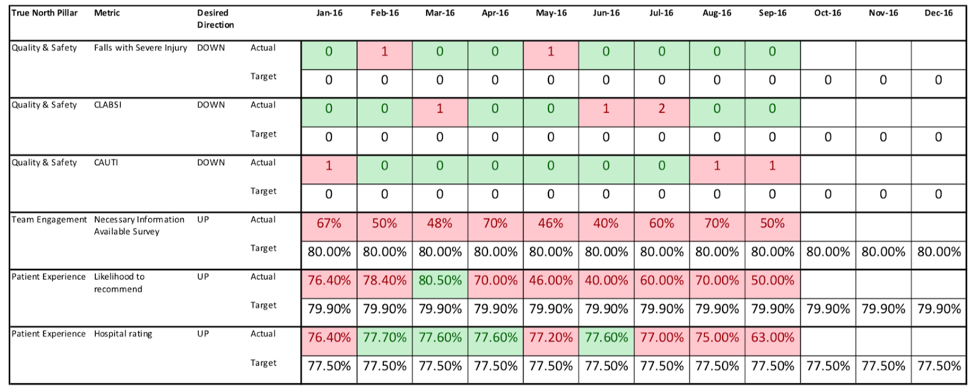
Looking at the bottom metric, the patient hospital rating, we see a mix of red and green. Are we meeting the target? Sometimes. Are we getting better? Can we predict future performance? Should we react to any of the latest figures? Those questions are harder to answer from the bowling chart. We might have been excited by three consecutive greens, only to be discouraged by the reds that followed. But, are all of those red data points worth reacting to? A Process Behavior Chart can point the way.
Use Process Behavior Charts to Know When the System Has Changed
Process Behavior Charts allow us to make better management decisions that lead to less wasted time and more improvement. When we react less, we can focus our efforts and improve more.
If the hospital ratings metric (the bottom row of the bowling chart) is visualized as what’s called an “X Chart,” we see the following chart, which shows the data, the average, and two lines that represent the “Natural Process Limits” of the system and the metric. These upper and lower limits are calculated from the inherent level of variation in our baseline data. These limits are not chosen and should not be confused with targets or goals.

The X Chart makes it much clearer that we had a metric that had been fluctuating around an average that happened to be near the target. There is routine variation, or “noise,” in any system or metric. A stable workplace system will sometimes generate a higher number in some months and a lower number in others. That’s a fact of life. Not every change in the metric is equally meaningful.
The last data point, which might have looked like just another red box on the Bowling Chart, stands out on the X Chart. That last data point is well below the calculated “Lower Natural Process Limit.” The last data point is a “signal” that something has significantly changed in the system and is worth investigating – we could grab an A3 and do some root cause analysis, trying to understand why the hospital rating score dropped so much, so quickly. The August data point is actually just below the lower limit, so that would have been an even more timely time to react and that could have been an early indicator that our process was degrading before the big drop in September
The Process Behavior Chart is designed to filter out noise in the metric so we can detect signals. In too many “Lean Management System” environments, I see leaders asking people to explain noise in the metric. There is no “root cause” to be found for every up and down in the metric. Noise is generated by dozens or sometimes hundreds of “common causes” that are commingled and intertwined.
It would not be a good use of time for a leader to ask, “Why was the July number lower than June?” The answer to improving the metric would not be found in asking, “Why was that one month better?” if that month was also part of the noise in the metric.
Three Rules for Finding Signal in the Noise
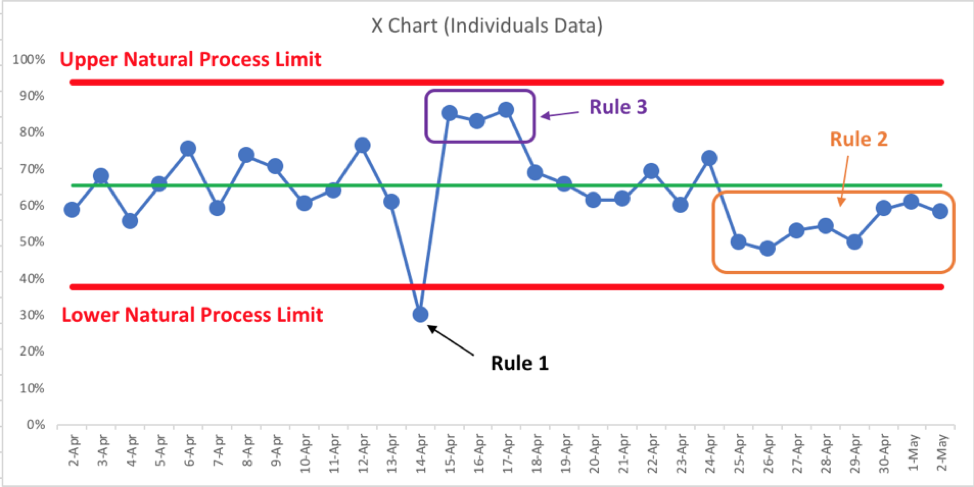
The Process Behavior Chart methodology gives us three rules to use when evaluating an X Chart for signals. We don’t have to guess. We don’t have to rely on rules of thumb like, “Investigate every below-average data point” or “react when we have two data points in the red.” Instead, you might consider reacting to any of these three rules:
- Rule 1: Any data point outside of the limits.
- Rule 2: Eight consecutive points on the same side of the central line.
- Rule 3: Three out of four consecutive data points that are closer to the same limit than they are to the central line.
A signal, as detected by these three rules, is statistical proof that the underlying system has changed. If we have a predictable system that is merely fluctuating within a certain range, it’s unlikely to produce, for example, a point outside the limits by mere chance alone. A predictable system is also unlikely to produce eight consecutive data points on the same side of the average. Seeing that would be another signal that the underlying system has changed.
The three rules are illustrated in this X Chart for a different metric:
When we see a signal, that’s a good time to ask, “What happened?” If we only see noise, we can still try to improve that predictable system – but using an A3 and that process will get us better results than asking reactive questions about noise.
Back to the first example, when we found the Rule 1 signal below the Lower Limit, we’d hope the organization could identify a root cause of the decreased patient satisfaction. The hospital could hope to get the metric back up into its typical, predictable range. Or, better yet improve performance altogether. The Process Behavior Chart methodology can be used to find a significant shift in the metric, looking for a Rule 2 signal, as seen below:

As the hospital acted to improve patient satisfaction, we see more than eight consecutive points above the old average starting in October. This provides better statistical proof of improvement than any Bowling Chart ever could. The metric has established a higher average and can now be expected to fluctuate between the newly-calculated Lower and Upper Limits. We can predict that this metric will always be better than the target – unless something again changes in the system or we increase our target to spur further improvement.
Let’s Improve Our Lean Improvement System
I was fortunate to be exposed to this methodology more than twenty years ago. It’s not complicated; it’s just a bit different than the way we’ve always done Lean management in many organizations. And we’re supposed to be continuously improving our Lean management system instead of sticking to the way we’ve always done things, right? We shouldn’t just focus on the waste of frontline workers — we should also focus on reducing the waste of motion that’s triggered by overreacting to noise in a metric. Process Behavior Charts can help and should be a part of any Lean journey.
Mark’s new title, “Measures of Success: React Less, Lead Better, Improve More,” is available now as an eBook through Amazon Kindle and Apple Books. The book explains the details of how to create Process Behavior Charts and the key mindsets that help drive more improvement with less waste.